Creating Visual Dependency Graphs
The fromager graph to-dot command converts your dependency graph into a DOT format file that can be used with Graphviz to create visual representations of your package dependencies.
Prerequisites
To create images from DOT files, you’ll need Graphviz installed:
# On macOS with Homebrew
brew install graphviz

# On Ubuntu/Debian
sudo apt-get install graphviz

# On RHEL/CentOS/Fedora
sudo dnf install graphviz
Basic Usage
Convert a graph file to DOT format:
fromager graph to-dot e2e/build-parallel/graph.json
This outputs the DOT format to stdout. To save it to a file:
fromager graph to-dot e2e/build-parallel/graph.json --output dependency-graph.dot
Creating Visual Images
Once you have a DOT file, create a PNG image:
fromager graph to-dot e2e/build-parallel/graph.json --output graph.dot
dot -Tpng graph.dot -o dependency-graph.png
digraph {

  node1 [label="" style="filled,bold" color=black fillcolor=white fontcolor=black shape=circle]
  node2 [label="cython==3.1.1" style="filled,dashed" color=black fillcolor=white fontcolor=black shape=oval]
  node3 [label="flit-core==3.12.0" style="filled,dashed" color=black fillcolor=white fontcolor=black shape=oval]
  node4 [label="imapautofiler==1.14.0" style="filled,bold" color=black fillcolor=white fontcolor=black shape=oval]
  node5 [label="imapclient==3.0.1" style="filled,bold" color=black fillcolor=white fontcolor=black shape=oval]
  node6 [label="jaraco-classes==3.4.0" style="filled,bold" color=black fillcolor=white fontcolor=black shape=oval]
  node7 [label="jaraco-context==6.0.1" style="filled,bold" color=black fillcolor=white fontcolor=black shape=oval]
  node8 [label="jaraco-functools==4.1.0" style="filled,bold" color=black fillcolor=white fontcolor=black shape=oval]
  node9 [label="jinja2==3.1.6" style="filled,bold" color=black fillcolor=white fontcolor=black shape=oval]
  node10 [label="keyring==25.6.0" style="filled,bold" color=black fillcolor=white fontcolor=black shape=oval]
  node11 [label="markupsafe==3.0.2" style="filled,bold" color=black fillcolor=white fontcolor=black shape=oval]
  node12 [label="more-itertools==10.7.0" style="filled,bold" color=black fillcolor=white fontcolor=black shape=oval]
  node13 [label="packaging==25.0" style="filled,dashed" color=black fillcolor=white fontcolor=black shape=oval]
  node14 [label="pyyaml==6.0.2" style="filled,bold" color=black fillcolor=white fontcolor=black shape=oval]
  node15 [label="setuptools-scm==8.3.1" style="filled,dashed" color=black fillcolor=white fontcolor=black shape=oval]
  node16 [label="setuptools==80.8.0" style="filled,dashed" color=black fillcolor=white fontcolor=black shape=oval]
  node17 [label="wheel==0.46.1" style="filled,dashed" color=black fillcolor=white fontcolor=black shape=oval]

  node1 -> node4 [labeltooltip="imapautofiler==1.14.0" style=dotted]
  node4 -> node16 [labeltooltip="setuptools" style=dotted]
  node4 -> node15 [labeltooltip="setuptools_scm[toml]>=6.2" style=dotted]
  node4 -> node14 [labeltooltip="PyYAML>=3.11"]
  node4 -> node5 [labeltooltip="imapclient>=2.2.0"]
  node4 -> node9 [labeltooltip="jinja2>=2.11.2"]
  node4 -> node10 [labeltooltip="keyring>=10.0.0"]
  node15 -> node16 [labeltooltip="setuptools>=61" style=dotted]
  node15 -> node13 [labeltooltip="packaging>=20" style=dotted]
  node14 -> node2 [labeltooltip="Cython; python_version < '3.13'" style=dotted]
  node14 -> node16 [labeltooltip="setuptools" style=dotted]
  node14 -> node17 [labeltooltip="wheel" style=dotted]
  node5 -> node16 [labeltooltip="setuptools>=40.8.0" style=dotted]
  node9 -> node3 [labeltooltip="flit_core<4" style=dotted]
  node9 -> node11 [labeltooltip="MarkupSafe>=2.0"]
  node10 -> node16 [labeltooltip="setuptools>=61.2" style=dotted]
  node10 -> node15 [labeltooltip="setuptools_scm[toml]>=3.4.1" style=dotted]
  node10 -> node6 [labeltooltip="jaraco.classes"]
  node10 -> node7 [labeltooltip="jaraco.context"]
  node10 -> node8 [labeltooltip="jaraco.functools"]
  node6 -> node16 [labeltooltip="setuptools>=56" style=dotted]
  node6 -> node15 [labeltooltip="setuptools_scm[toml]>=3.4.1" style=dotted]
  node6 -> node12 [labeltooltip="more_itertools"]
  node7 -> node16 [labeltooltip="setuptools>=61.2" style=dotted]
  node7 -> node15 [labeltooltip="setuptools_scm[toml]>=3.4.1" style=dotted]
  node8 -> node16 [labeltooltip="setuptools>=61.2" style=dotted]
  node8 -> node15 [labeltooltip="setuptools_scm[toml]>=3.4.1" style=dotted]
  node8 -> node12 [labeltooltip="more_itertools"]
  node12 -> node3 [labeltooltip="flit_core<4,>=3.2" style=dotted]
  node13 -> node3 [labeltooltip="flit_core>=3.3" style=dotted]
  node11 -> node16 [labeltooltip="setuptools>=70.1" style=dotted]
  node2 -> node16 [labeltooltip="setuptools>=40.8.0" style=dotted]
  node17 -> node3 [labeltooltip="flit_core<4,>=3.8" style=dotted]
  node17 -> node13 [labeltooltip="packaging>=24.0" style=dotted]
}
Complete Example
Here’s a complete workflow to create a visual dependency graph:
# Create DOT file from graph
fromager graph to-dot e2e/build-parallel/graph.json --output full-graph.dot

# Create PNG image
dot -Tpng full-graph.dot -o full-dependency-graph.png

# Create a simplified version with only install dependencies
fromager graph to-dot e2e/build-parallel/graph.json --install-only --output install-graph.dot
dot -Tpng install-graph.dot -o install-dependencies.png
Options
Install Dependencies Only
Use --install-only to show only runtime installation dependencies, excluding build-time dependencies:
fromager graph to-dot e2e/build-parallel/graph.json --install-only --output runtime-deps.dot
This creates a cleaner graph focused on what gets installed rather than what’s needed for building.
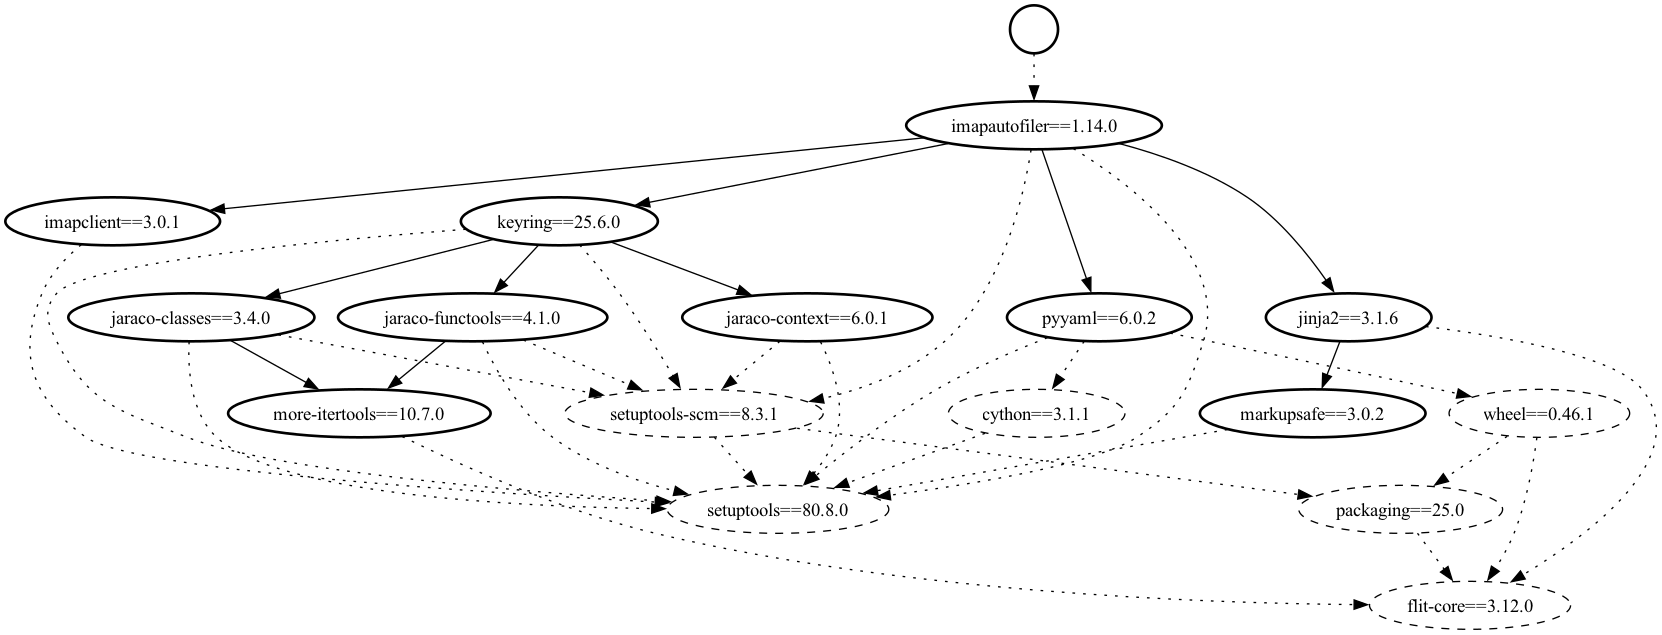
Understanding the Visual Output
The generated graph uses different visual elements to represent different types of packages:
Node Shapes:
Circle: Top-level requirements
Oval: Regular dependencies
Box: Packages with build settings/overrides
Parallelogram: Pre-built packages
Note shape: Packages with patches
Trapezium: Packages with plugins
Triple octagon: Packages with both plugins and patches
Edge Styles:
Solid lines: Installation dependencies
Dotted lines: Build-system dependencies
Bold edges: Installation constraints (when not using –install-only)
Dashed edges: Build-only dependencies (when not using –install-only)
Colors:
All nodes have black borders with white fill by default
Bold edges indicate packages that will be installed in the final environment